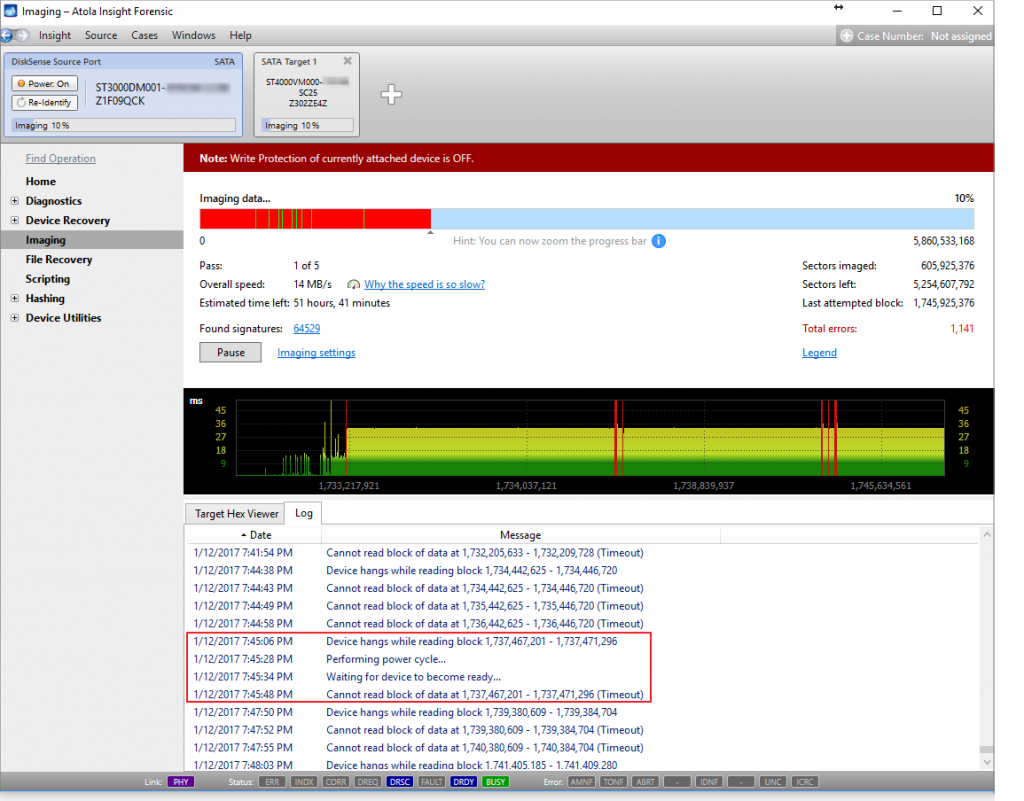
Recently, we received an email from a long-standing client. The drive he was imaging contained a large number of errors. We would like to use this screenshot of a real-case imaging process to illustrate how well Atola Insight Forensic handles imaging hard drives in such dire state.
In the screenshot the numbers show that despite encountering over 1100 errors, Insight has already imaged 605 million sectors out of 1,745 million sectors it has attempted to image in this first pass. The speed may seem low, but Insight is actually able to read it, while most other imagers will likely be unable to even identify such device.
Second, in this screenshot we have yet another example of the freezing drive recovery algorithm in action, which helps make the imaging process much more efficient when imaging severely damaged drives like the one in our example. We have recently posted a guide explaining how it works and helps Insight avoid long idle periods waiting for the disk to become ready.
As for the situation in the screenshot: according to the algorithm, Insight issued two consecutive resets (only after executing the second reset Insight adds a message to the Log saying Device freezes while reading block X – Y, as shown in the red box area of the screenshot). Apparently, the drive has not become ready after both resets, and according to the freezing drive recovery algorithm, Insight executed a power cycle, which proved effective: the drive became ready to start reading the next planned block of sectors.

Finally, there are two graphs that reflect imaging progress: the upper one is called imaging map bar and shows imaging progress throughout the whole drive space. The lower one is called read speed graph and shows the time Insight spent reading recently imaged sectors. You might have noticed a few discrepancies about these graphs:
- Why does the imaging map bar indicate that 10% of the drive have been imaged, but the progress bar looks more like 30% of the total drive space?
The bar reflects the media space between the first and the last sectors. The percentage indicates only the ratio of successfully imaged sectors and does not include the skipped blocks: in its first pass Insight performs one-million-sector jumps when encountering bad sectors. When Insight returns to the skipped blocks during the following passes, it will allocate more time to read each sector and will add the successfully imaged sectors to that percentage. - Why do the red zones in the Imaging map bar look larger than those in the read speed graph?
Each pixel in the Imaging map bar stands for thousands of sectors. The map gives priority to showing the location of errors as opposed to showing the location of good sectors. And being limited by the screen size and resolution, the imaging map bar may look very red in the course of imaging a drive with a large amount of errors. Especially during the first pass, before attempting to read the problematic sectors more thoroughly. - Why do the equally sized ranges in the read speed graph, contain substantially different numbers of sectors, according to the LBA values?
range 1. there are 819,200 sectors between 1,733,217,921 and 1,734,037,121,
range 2. there are 4,802,816 sectors between 1,734,037,121 and 1,738,839,937,
range 3. there are 6,794,624 sectors between 1,738,839,937 and 1,745,634,561.
The spans are different because of the number of bad blocks of sectors located between them. During the first pass, Insight performs a jump by 1 million sectors each time it encounters a block of sectors, which it cannot read.
- Top digital forensic conferences in 2025 - January 7, 2025
- 2024. Year in Review - January 1, 2025
- 2023. Year in Review - December 31, 2023
Yulia Samoteykina
Director of Marketing Yulia believes that with a product that is exceptionally good at solving tasks of forensic experts, marketing is about explaining its capabilities to the users. Yulia regularly represents Atola at DFIR events, holds free workshops and webinars about Atola imagers functionality and advocates on the users' behalf to ensure that Atola keeps on adding value and raising the bar for the industry.


